
Potential Clinical Applications
Gastroenterology and Hepatology Applications
- Initial workup for NAFLD diagnosis and for patient education and counselling.
- Liver fat analysis on patients already being screened or monitored for fibrosis or cirrhosis. Recent research indicates that patients with NAFLD and NASH can develop liver cancer without progressing through cirrhosis.
Surgical Applications
- Scanning of patients with liver disease or liver cancer to provide guidance with treatment planning. The liver percent fat may help to determine how much liver can be safely resected or to determine whether to use a surgical or non-surgical treatment. A high level of liver fat may have a detrimental outcome on liver surgery.
- Screening for suitability of living donors for liver transplants by assisting in determining the viability of the liver
- Pre and post operative analysis of bariatric patients to track clinical outcomes.
Applications by Primary Care Physicians
- HepaFat-Scan may be useful to screen patients prior to prescribing known hepatotoxic medications.
- Monitoring of patients undergoing an intervention (e.g. limiting alcohol consumption or weight loss)
- Monitoring of patients prescribed medications known to induce steatosis
HepaFat-Scan Clinical Validation
Resonance Health has completed a clinical study comparing 59 patient measurements of liver fat fraction using HepaFat-Scan and stereological analysis of liver biopsy sections. Stereology is a computer assisted analysis of each biopsy specimen to quantify the volume fraction of the biopsy that is fat. The HepaFat-Scan results can be directly compared against the biopsy measurements as both report a volume percentage of fat. The results of the comparison are illustrated in the figure below. A linear relationship between the two sets of measurements was found with a clinically insignificant bias (1.4% by Bland Altman analysis) between the two types of measurement.
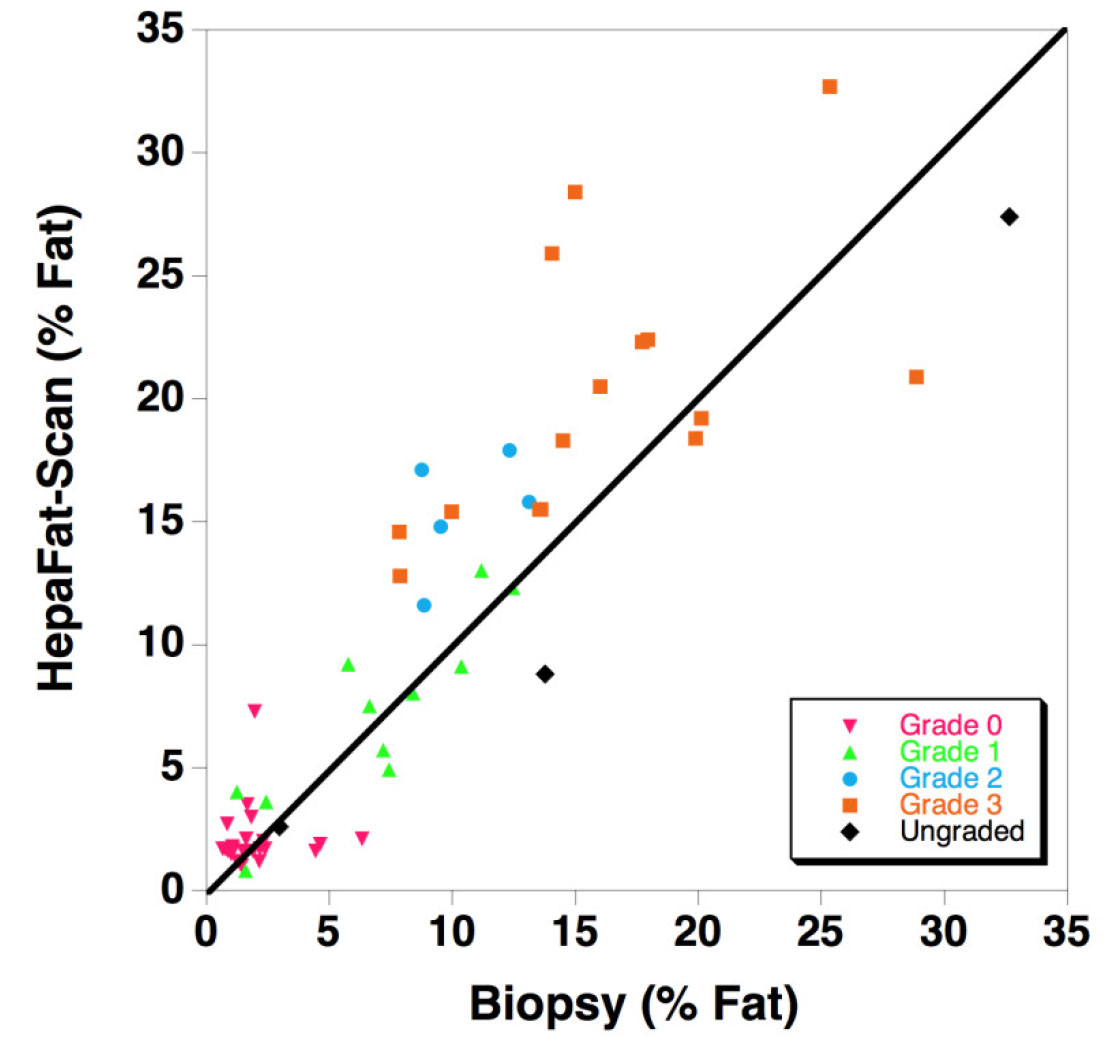
The figure displays a comparison of HepaFat-Scan measurements of liver fat fraction with those measured from biopsy sections using stereology (n=59). The solid line is the line of equivalence. Symbols are colour/shape-coded to indicate the NAS CRN steatosis grade assessed by a histopathologist according to the below table using the Nonalcoholic Steatohepatitis Clinical Research Network grading scheme [Design and Validation of a Histological Scoring System for Nonalcoholic Fatty Liver Disease, Hepatology, June 2005, Kleiner et al]:
- Grade 0: < 5% parenchymal involvement by steatosis
- Grade 1: 5% – 33% parenchymal involvement by steatosis
- Grade 2: >33%-66% parenchymal involvement by steatosis
- Grade 3: >66% parenchymal involvement by steatosis
All grades of steatosis were represented in the study [Grade 0 (47%); Grade 1 (13%); Grade 2 (9%); Grade 3 (30%)]. The patients in the study had a range of aeitiologies including autoimmune hepatitis (n=3), alcoholic liver disease (n=2), chronic viral hepatitis B/C (n=16), non-alcoholic fatty liver disease (n=10), nonalcoholic steatohepatitis (n=17), primary sclerosing cholangitis (n=4).
| Sensitivity and Specificity of HepaFat-Scan | |||
|---|---|---|---|
| Steatosis Grades |
Grade 0 vs 1-3 (≥5%) |
Grades 0-1 vs 2-3 (≥33%) |
Grades 0-2 vs 3 (≥66%) |
|
Sensitivity (%) (95% conf interval) |
96.77 (83-100) | 100.00 (83-100) | 100.00 (78-100) |
|
Specificity (%) (95% conf interval) |
96.00 (80-100) | 94.44 (81-99) | 87.80 (74-96) |
| AUROC (standard error) | 0.963 (0.032) | 0.996 (0.005) | 0.971 (0.019) |